Monitoring with Prometheus and Grafana
I've been using Prometheus and Grafana to monitor my physical and virtual machines for several months, and I recently started monitoring my router running OpenWrt as well.. I think these are great tools to "see" what's happening on my infrastructure. These are my "eyes" regarding my machines and my network.
Here's an overview of the components at play on a Prometheus / Grafana monitoring setup (the arrows show the flow of data):
                  +--------+
                  | Alerts |
                  +---+----+
                      ^
                      |
+---------+     +------------+     +------------+
| Grafana |--<--| Prometheus |--<--| Prometheus |
+---------+     +-----+------+     | Exporter   |
                      |            +------------+
                  +---+---+
                  | TSDB  |
                  | Store |
                  +-------+
Prometheus Exporters
The Prometheus exporter (on the right) exposes metrics from a machine
or a system (for instance a Ceph cluster). It exposes an HTTP endpoint
that can be used to fetch metrics at any point in time. This component
is usually stateless, it exposes metrics that are otherwise available
through non-http APIs (like Operating System metrics that are exposed
through the /proc virtual filesystem on Linux).
Example:
$ curl -s http://amn:9100/metrics | head
# HELP go_gc_duration_seconds A summary of the GC invocation durations.
# TYPE go_gc_duration_seconds summary
go_gc_duration_seconds{quantile="0"} 4.1607e-05
go_gc_duration_seconds{quantile="0.25"} 9.4745e-05
go_gc_duration_seconds{quantile="0.5"} 0.000130829
go_gc_duration_seconds{quantile="0.75"} 0.00019809
go_gc_duration_seconds{quantile="1"} 0.01378869
go_gc_duration_seconds_sum 11.704103484000001
go_gc_duration_seconds_count 26788
# HELP go_goroutines Number of goroutines that currently exist.
I am currently using the following exporters:
-
Prometheus Node exporter: "Prometheus exporter for hardware and OS metrics exposed by *NIX kernels, ...". This is part of the Prometheus project and basically exposes a lot of Linux system metrics. That's deployed on all of my machines and VMs.
-
Ceph Manager's Prometheus Module: "Provides a Prometheus exporter to pass on Ceph performance counters from the collection point in ceph-mgr". This is a module, part of the Ceph Manager Daemon, that exposes Ceph related metrics over an HTTP endpoint consumable by Prometheus.
-
OpenWrt's prometheus-node-exporter-lua: "Provides node metrics as Prometheus scraping endpoint. This service is a lightweight rewrite in LUA of the official Prometheus node_exporter."
-
Prometheus Blackbox exporter: "The blackbox exporter allows blackbox probing of endpoints over HTTP, HTTPS, DNS, TCP and ICMP." This exporter makes (ICMP in my case) requests to chosen endpoints, and exposes metrics like (requests duration, requests success/failure status, ...). This is great to monitor the availability of a service from the point of view of the the blackbox exporter probe. The behavior there is a bit more complex that with the previous exporters, as shown in the next figure:
Blackbox exporter interactions:
+---------+     +------------+     +----------+     +-----------+
| Grafana |--<--| Prometheus |--<--| Blackbox |-->--| Monitored |
+---------+     +------------+     | Exporter |     | Endpoint  |
                                   +----------+     +-----------+
Prometheus Node exporter
Prometheus exporters are usually installed directly on the nodes to be monitored. For instance the "Prometheus Node exporter", as well as many others, is packaged by most Linux distributions, as on Ubuntu 20.04:
$ apt list "prometheus-*-exporter"
Listing... Done
prometheus-apache-exporter/focal 0.7.0+ds-1 amd64
prometheus-bind-exporter/focal 0.3.0+ds-1 amd64
prometheus-bird-exporter/focal 1.2.2-1 amd64
prometheus-blackbox-exporter/focal 0.13.0+ds-2 amd64
prometheus-hacluster-exporter/focal 0.4.0-2 amd64
prometheus-haproxy-exporter/focal 0.9.0+git20180917+ds-1 amd64
prometheus-ipmi-exporter/focal 1.1.0+ds-1 amd64
prometheus-mongodb-exporter/focal 1.0.0+git20180522.e755a44-1 amd64
prometheus-mysqld-exporter/focal 0.11.0+ds-1 amd64
prometheus-nginx-exporter/focal 0.5.0+ds-2 amd64
prometheus-nginx-vts-exporter/focal 0.10.3+git20180501.43b4556+ds-2 amd64
prometheus-node-exporter/focal 0.18.1+ds-2 amd64
prometheus-pgbouncer-exporter/focal,focal 1.7-1 all
prometheus-postfix-exporter/focal 0.2.0-2 amd64
prometheus-postgres-exporter/focal 0.8.0+ds-1 amd64
prometheus-process-exporter/focal 0.4.0+ds-1 amd64
prometheus-snmp-exporter/focal 0.16.1+ds-1build1 amd64
prometheus-sql-exporter/focal 0.2.0.ds-6 amd64
prometheus-squid-exporter/focal 1.8.2+ds-1 amd64
prometheus-trafficserver-exporter/focal,focal 0.3.2-1 all
prometheus-varnish-exporter/focal 1.5.2-1 amd64
Also, the latest release of the "Prometheus Node exporter" is also available on its GitHub release page. As it is written in Go, no dependencies are required to run the binary.
Prometheus Node exporter on OpenWrt
Monitoring a router can provide a lot of insights on what's happening on a network. OpenWrt is a Linux distribution that can run on some routers (including my Ubiquiti EdgeRouter X). And there is a rewrite of the official "Prometheus Node exporter" in Lua, with several plugins, packaged for the OpenWrt distribution.
# opkg list "prometheus-*-exporter-*"
prometheus-node-exporter-lua - 2019.11.17-1 - Provides node metrics as Prometheus scraping endpoint.

 This service is a lightweight rewrite in LUA of the offical Prometheus node_exporter.
prometheus-node-exporter-lua-bmx6 - 2019.11.17-1 - Prometheus node exporter (bmx6 links collector)
prometheus-node-exporter-lua-bmx7 - 2019.11.17-1 - Prometheus node exporter (bmx7 links collector)
prometheus-node-exporter-lua-nat_traffic - 2019.11.17-1 - Prometheus node exporter (nat_traffic collector)
prometheus-node-exporter-lua-netstat - 2019.11.17-1 - Prometheus node exporter (netstat collector)
prometheus-node-exporter-lua-openwrt - 2019.11.17-1 - Prometheus node exporter (openwrt collector)
prometheus-node-exporter-lua-textfile - 2019.11.17-1 - Prometheus node exporter (textfile collector)
prometheus-node-exporter-lua-wifi - 2019.11.17-1 - Prometheus node exporter (wifi collector)
prometheus-node-exporter-lua-wifi_stations - 2019.11.17-1 - Prometheus node exporter (wifi_stations collector)
Once deployed, the prometheus-node-exporter-lua exposes router
metrics, that can be consumed by Prometheus:
$ curl -s http://edgewrt.lan:9100/metrics | head
# TYPE node_scrape_collector_duration_seconds gauge
# TYPE node_scrape_collector_success gauge
# TYPE node_nf_conntrack_entries gauge
node_nf_conntrack_entries 288
# TYPE node_nf_conntrack_entries_limit gauge
node_nf_conntrack_entries_limit 16384
node_scrape_collector_duration_seconds{collector="conntrack"} 0.00080108642578125
node_scrape_collector_success{collector="conntrack"} 1
# TYPE node_boot_time_seconds gauge
node_boot_time_seconds 1601844891
Prometheus Blackbox exporter
The Blackbox exporter is a different beast. It can run anywhere (a process on a machine, or a container in Kubernetes) and exposes an HTTP endpoint providing us with metrics about target endpoints. The targets are provided as argument when querying the Blackbox exporter. Here's an example:
$ curl -s "http://blackbox.w.lan/probe?target=kynwrt.lan&module=icmp" | head
# HELP probe_dns_lookup_time_seconds Returns the time taken for probe dns lookup in seconds
# TYPE probe_dns_lookup_time_seconds gauge
probe_dns_lookup_time_seconds 0.0150718
# HELP probe_duration_seconds Returns how long the probe took to complete in seconds
# TYPE probe_duration_seconds gauge
probe_duration_seconds 0.019866343
# HELP probe_icmp_duration_seconds Duration of icmp request by phase
# TYPE probe_icmp_duration_seconds gauge
probe_icmp_duration_seconds{phase="resolve"} 0.0150718
probe_icmp_duration_seconds{phase="rtt"} 0.004375455
Prometheus
Scrape configuration
Now that we have setup our Prometheus exporters and that our metrics
are available on HTTP endpoints, we can tell Prometheus where to grab
its metrics through the scrape_configs block of Prometheus
configuration file:
scrape_configs:
  - job_name: os
    static_configs:
      - targets:
          - kube-master0.lan:9100
          - kube-worker0.lan:9100
          - kube-worker1.lan:9100
At that point, Prometheus will start collecting the metrics at regular
intervals, as specified by the scrap_interval key in the config
file. It will store these metrics in its local TSDB (Time series
database), although Prometheus can be instructed to use an external
storage.
Prometheus Query Language
From now on, we can connect to Prometheus web UI and perform some queries on our time series using PromQL (Prometheus Query Language). For instance:
node_memory_MemFree_bytes{instance="kube-worker0.lan:9100"}
A time series is identified by a metric (node_memory_MemFree_bytes)
and possibly one or more labels
(instance="kube-worker0.lan:9100"). As stated by Prometheus Data
Model documentation:
-
"The metric name specifies the general feature of a system that is measured (e.g. http_requests_total - the total number of HTTP requests received)."
-
"Labels enable Prometheus's dimensional data model: any given combination of labels for the same metric name identifies a particular dimensional instantiation of that metric (for example: all HTTP requests that used the method POST to the /api/tracks handler)."
PromQL also allows using functions like these:
irate(node_network_receive_bytes_total{instance="edgewrt.lan:9100"}[2m])
irate documentation says: "irate(v range-vector) calculates the per-second instant rate of increase of the time series in the range vector."
node_network_receive_bytes_total is actually a Counter, that
counts the total amount of bytes received through the network
interfaces. It keeps increasing until reset to zero. The rate and
irate functions allow respectively to compute per-second rate and
per-second instantaneous rate of increase for such counters. When
using such functions, one must specify a range upon which the rate is
computed ([2m] in that specific case).
Metrics types
Here's a glimpse at the four different types of metrics:
-
Counter: "A counter is a cumulative metric that represents a single monotonically increasing counter whose value can only increase or be reset to zero on restart."
-
Gauge: "A gauge is a metric that represents a single numerical value that can arbitrarily go up and down."
-
Histogram: "A histogram samples observations (usually things like request durations or response sizes) and counts them in configurable buckets."
-
Summary: "it calculates configurable quantiles over a sliding time window."
Grafana
Once queries have been crafted in the Prometheus web UI, one can copy/paste them in Grafana graphs. We can build dashboards with multiple graphs, each graph performing one or more PromQL queries against Prometheus time series. With this raw material, it's up to operators to build meaningful dashboards, so that they be able to monitor their infrastructure.
Also, there are a number of already made dashboards, that can be imported into Grafana.
Example: Monitoring network links
A use case I find interesting is how I monitor my PLC link (Power-line communication) between my two floors (since I noticed that this link had a tendency to fail). Here's the setup:
+----------+     +---------+         +--------+
| Blackbox |-->--| Edgewrt |====>====| Kynwrt |
| Probe    |     | Router  |   PLC   | Router |
+----------+     +---------+         +--------+
With the Prometheus Blackbox exporter, I can monitor the availability
of the routers at each end of my PLC link; I also monitor the latency
of the requests made against these 2 routers. That way, if edgewrt
is available while kynwrt isn't, chances are that the PLC link is
down. Of course, it doesn't provide me with the root cause of the
network split, but I know that something's going wrong, and where to
look to get more clues. Here are the requests I use:
- For monitoring the routers availability:
A = avg_over_time(probe_success{instance="kynwrt.lan"}[2m])
B = avg_over_time(probe_success{instance="edgewrt.lan"}[2m])
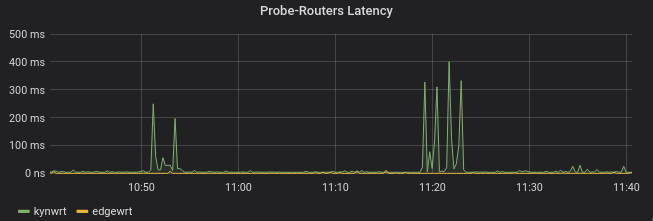
- For monitoring the latency between the probe and the routers:
A = probe_icmp_duration_seconds{instance="kynwrt.lan", phase="rtt"}
B = probe_icmp_duration_seconds{instance="edgewrt.lan", phase="rtt"}
Alerts
A bit I haven't talked about yet is Alerts. Prometheus can be configured to emit alerts according to user-defined rules. Here's what these rules look like:
rules:
  - alert: health error
    expr: ceph_health_status == 2
    for: 5m
    labels:
      severity: critical
      type: ceph_default
      oid: 1.3.6.1.4.1.50495.15.1.2.2.1
    annotations:
      description: >
        Ceph in HEALTH_ERROR state for more than 5 minutes.
        Please check "ceph health detail" for more information.
In order to handle these alerts properly and dispatch them, an additional component (The Prometheus Alert Manager) is required.
Here's what the doc says: "The Alertmanager handles alerts sent by client applications such as the Prometheus server. It takes care of deduplicating, grouping, and routing them to the correct receiver integration such as email, PagerDuty, or OpsGenie. It also takes care of silencing and inhibition of alerts."